Deprecated: Unparenthesized `a ? b : c ? d : e` is deprecated. Use either `(a ? b : c) ? d : e` or `a ? b : (c ? d : e)` in /home/wwwapp/spip/ecrire/inc/utils.php on line 2697
U-006-084-001 - NOTES - classeur U - Fonds d'archives Baulin
Des interviews exclusives de Dja-Apharou ISSA IBRAHIM, ami et confident de Jacques Baulin, responsable par donation de l’intégralité des documents constituant le fond, et président de l’association sont actuellement publiées dans la rubrique présentation.
Les trois ouvrages de J. Baulin : Conseiller du président Diori, La politique africaine d’Houphouët-Boigny et La politique intérieure d’Houphouët-Boigny
seront disponibles sur le site en version iBook et en version Pdf dès septembre
2009.
OAPEC
neufs bulletin octobre 1976 <.date>
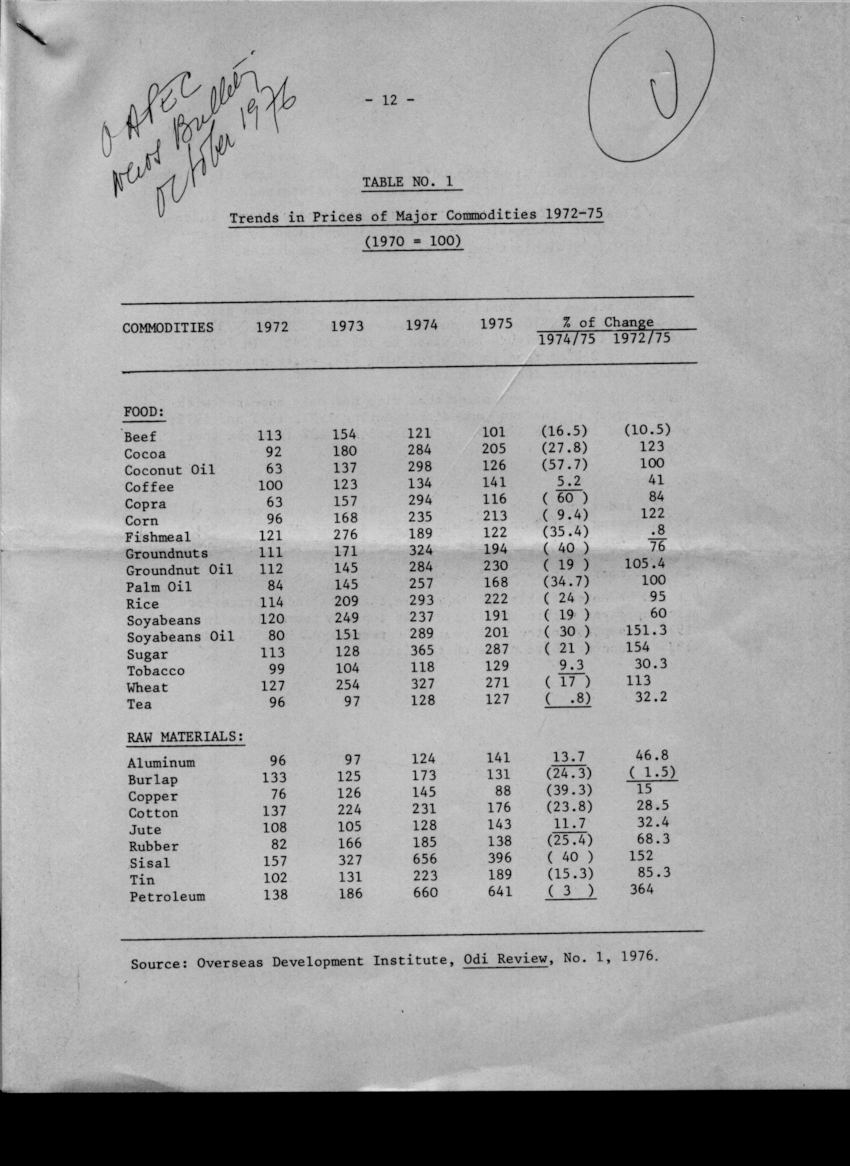
TABLE NO.1
Trend in Prices of Major Commodities 1972-75
(1970= 100)
COMMODITIES
1972
1973
1974
1975
% of Change
1974/75
% of Change
1972/75
FOOD
Beef
113
154
121
101
(16,5)
(10,5)
Cocoa
92
180
284
205
(27,8)
123
Coconut Oil
63
137
298
126
(57,7)
100
Coffee
100
123
134
141
5,2
41
Copra
63
157
294
116
(60)
84
Corn
96
168
235
213
(9,4)
122
Fishmeal
121
276
189
122
(35,4)
.8
Groundnuits
111
171
324
194
(40.)
76
Groundnuit Oil
112
145
284
230
(19)
105,4
Palm Oil
84
145
257
168
(34.7)
100
Rice
114
209
293
222
(24)
95
Soyabeans
120
249
237
191
(19)
60
Soyabeans Oil
80
151
289
201
(30)
151,3
Sugar
113
128
365
287
(21)
154
Tobacco
99
104
118
129
9,3
30,3
Wheat
127
254
327
271
(17)
113
Tea
96
97
128
127
(. 8)
32,2
RAW MATERIALS :
Aluminum
96
97
124
141
13,7
46,8
Burlap
133
125
173
131
(24,3)
(1,5)
Copper
76
126
145
88
(39,3)
15
Cotton
137
224
231
176
(23,8)
28,5
Jute
108
105
128
143
11,7
32,4
Rubber
82
166
185
138
(25.4)
68.3
Sisal
157
327
656
396
(40)
152
Tin
102
131
223
189
(15,3)
85,3
Petroleum
138
186
660
641
(3)
364
Source : Overseas Development Institute , Odi Review, No. 1, 1976
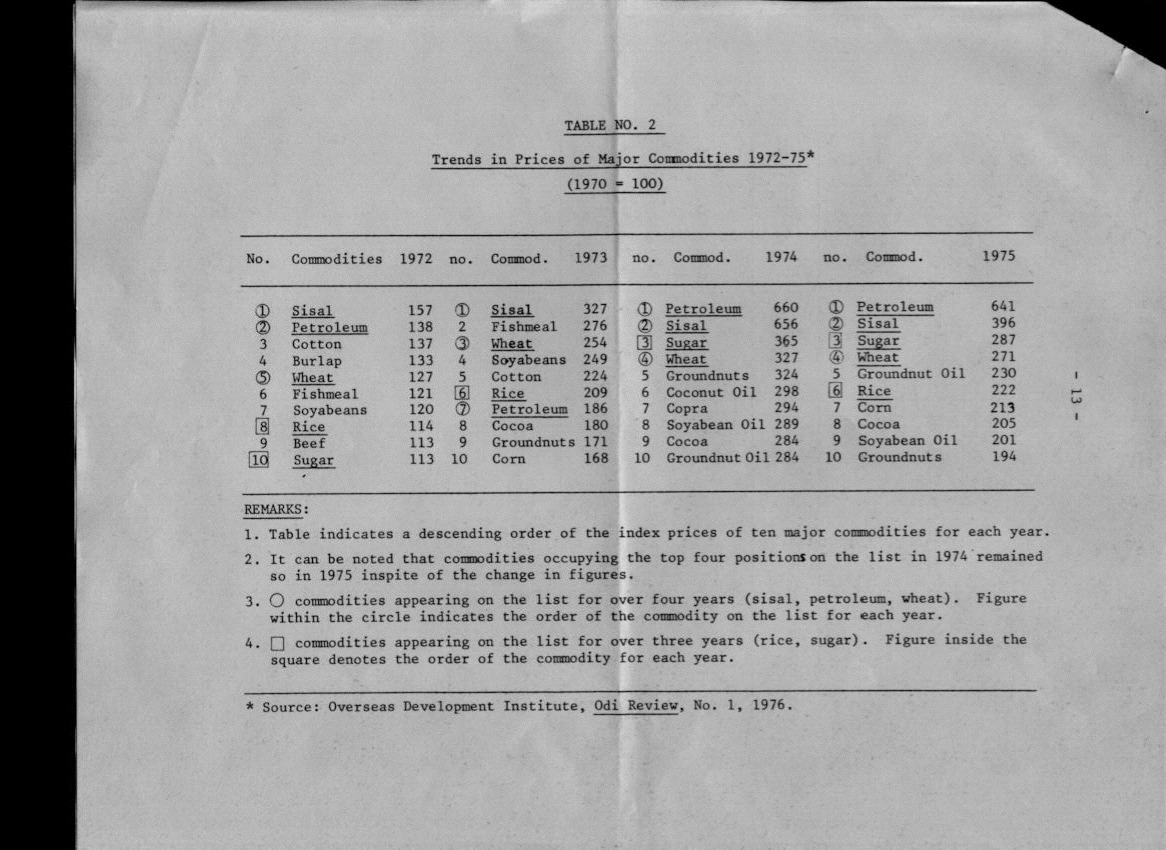
TABLE NO.2
Trend in Prices of Major Commodities 1972-75 Source : Overseas Development Institute , Odi Review, No.1, 1976 .
(1970=100)
NO.
Commodities
1972
no.
Commod.
1973
no.
Commod.
1974
no.
Commod.
1975
(1 )
Sisal
157
(1)
Sisal
327
(1)
Petroleum
660
(1)
Petroleum
641
(2)
Petroleum
138
2
Fishmeal
276
(2)
Sisal
656
(2)
Sisal
396
3
Cotton
137
(3)
Wheat
254
[3]
Sugar
365
[3]
Sugar
287
4
Burlap
133
4
Soyabeans
249
(4)
Wheat
327
(4)
Wheat
271
(5)
Wheat
127
5
Cotton
224
5
Groundnuits
324
5
Groundnuits Oil
230
6
Fishmeal
121
[6]
Rice
209
[6]
Coconut t Oil
298
6
Rice
222
7
Soyabeans
120
(7)
Petroleum
186
7
Corpa
294
7
Corn
213
[8]
Rice
114
8
Cocoa
180
8
Soyabean Oil
289
8
Cocoa
205
9
Beef
113
9
Groundnuts
171
9
Cocoa
284
9
Soyabean Oil
201
[10]
Sugar
113
10
Corn
168
10
Groundnut Oil
284
10
Groundnuts
194
</table
REMARKS :
1. Table indicates a descending order of the index prices of ten major commodities for each year.
2. It can be noted that commodities occupying the top four positions on the list in 1974 remained so in 1975 inspite of the change in figures.
3. ( ) commodities appearing on the list for over four years (sisal , petroleum , wheat ) . Figure within the circle indicates the order of the commodity on the list for each year.
4. [ ] commodities apperaring on the list for over three years (rice, sugar). Figure inside the square denotes the order of the commodity for each year.
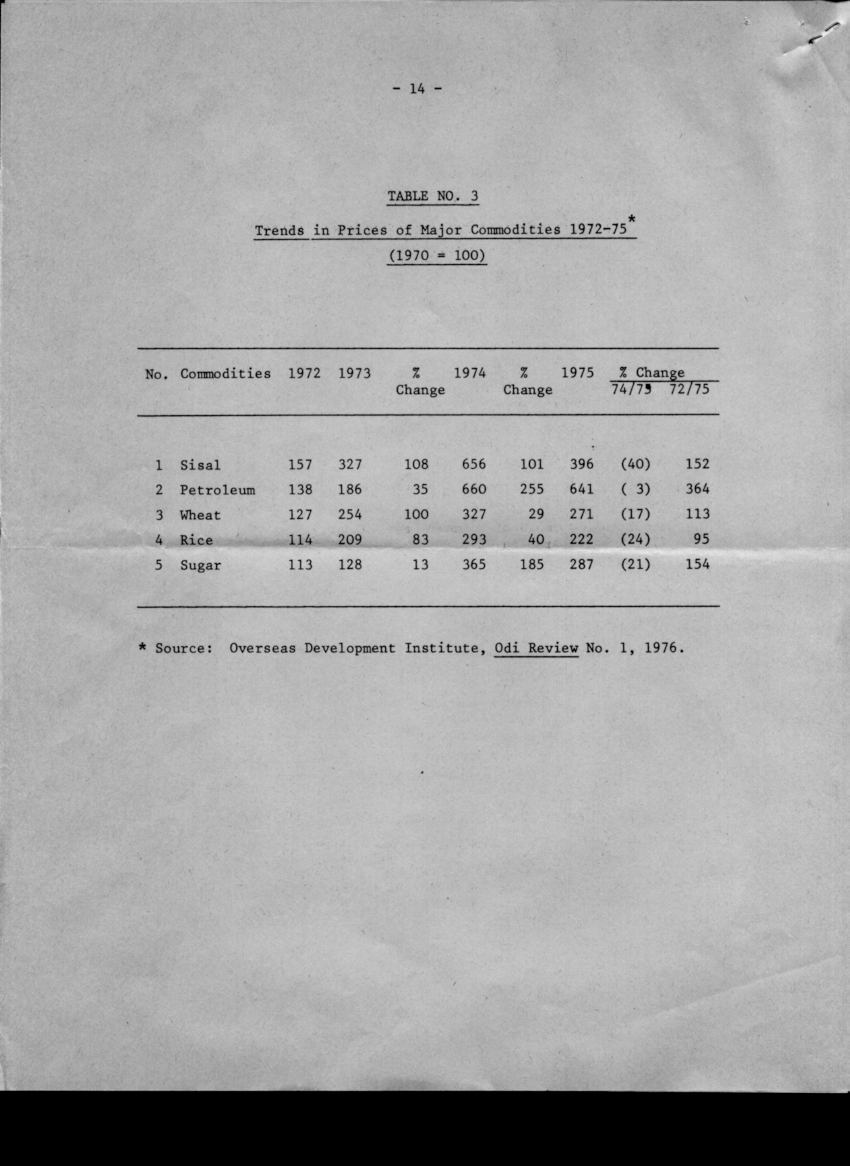
TABLE NO . 3
Trends in Prices of Major Commodities 1972-75 Sorce : Overseas Development Institute , Odi Review No . 1, 1976
(1970=100-
No.
Commodities
1972
1973
% Change
1974
% Change
1975
% Change 74/75
% Change 72/75
1
Sisal
157
327
108
656
101
396
(40)
152
2
Petroleum
138
186
35
660
255
641
(3)
364
3
Wheat
127
254
100
327
29
271
(17)
113
4
Rice
114
209
83
293
40
222
(24)
95
5
Sugar
113
128
13
365
185
287
(21)
154
info portfolio
Fonds d’archives Baulin (http://www.fonds-baulin.org), développé par Résurgences,
est mis à disposition selon les termes de la licence Creative Commons :
Paternité-Pas d’Utilisation Commerciale-Pas de Modification 2.0 France.